
Anthony Fung, Alex Tran, Diwei Xiong
Advisors: Sheik Sadique, Frederic Broccard, Gert Cauwenburghs, Bruce Wheeler
University of California, San Diego, Department of Bioengineering

The Interface
We are presenting a fully integrated Spiking Neural Network GUI program capable of simulating a variety of biological neuron models network structures. This allows researchers who are not experienced in programming to create complex neuron structures using only a GUI interface. Users are able to input experimental parameters and dictate network structure all with the click of the mouse. Once parameters are chosen, network visualization, as well as a variety of important plots can be generated. Additionally, functionality to import patch-clamp data may be updated to help model experiments.
Experimental Design and Testing
Modeling
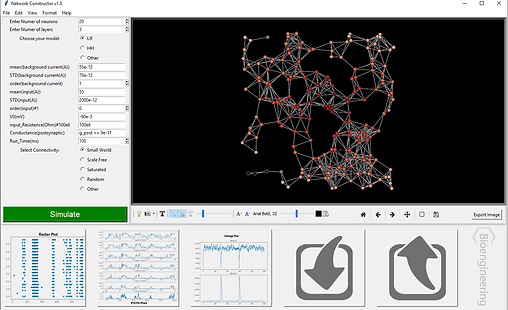
Network Construction began with a conductance-based model using the equations common in the literature. BRIAN2 python packages were implemented to make symbolic equations interpretable by the GUI

Building
Spiking Neural Network modeling was initially carried out in Jupyter Notebooks until a conductance based model successfully demonstrated the reproduction of published signal preservation properties in pulse coded networks.
A GUI wrapper was designed in the Spyder coding environment with Tkinter packages for user input. Each functionality in the Jupyter Notebook was accounted for in separate method definitions created in the Spyder environment.
Visual network representations are achieved using Network X packages, and graph displays were achieved using Matplotlib toolboxes.
Testing
Rat brains containing wild type Schaffer collaterals and those with mutated constructs were excised and immediately patch-clamped according to the figure above. Data was analyzed using a separate MATLAB script written for the purpose of isolating an injection stimulus for the spiking neural network GUI.


Results
Using the results derived from the evoked AMPA Excitatory Post Synaptic Currents (EPSC), the following PSTH plot was generated for n=10 layers. The PSTH plot illustrates the firing of neurons in a given time. This is very basic, yet intuitive representation of synaptic depression characteristic in AD brains. The deterioration of the dendritic spines result in a modulation of the rate at which ions transport across the membrane until the summative effect reaches the threshold to fire. Across several randomly connected layers, the signal is not preserved, which may be likened to poor information transfer in the brain.